

Administrator guide
The dashboard and the console tour
This chapter tours the YuviRed console: the sidebar, the top bar and the Dashboard page. It explains every number on the Dashboard, how fresh it is, how to read the red, amber and blue states, and where to click next. The example company in this guide is "Northwind Dental". All names, addresses and numbers are made up.
Examples use computer names such as NW-FRONTDESK-01, the user a.rivera and the address 192.0.2.10.
1. Before you start
- You need a signed-in console account. Role matters: an Admin sees every menu item, an Analyst sees most, and a View Only user sees the monitoring pages but not the Enforcement page or the Admin and Deploy sections. A page that your role cannot open is hidden, not greyed out.
- The console is reached at the address of your YuviRed server, for example https://192.0.2.10:8443. Your browser may warn about the server's certificate if the installation uses its own; that is covered in the installation guide.
- YuviRed Lite is the edition described here. It covers 10 computers plus the server itself, and 5 AI agents in AMS (Agent Monitoring System). Pro and Enterprise show the same pages with higher limits.
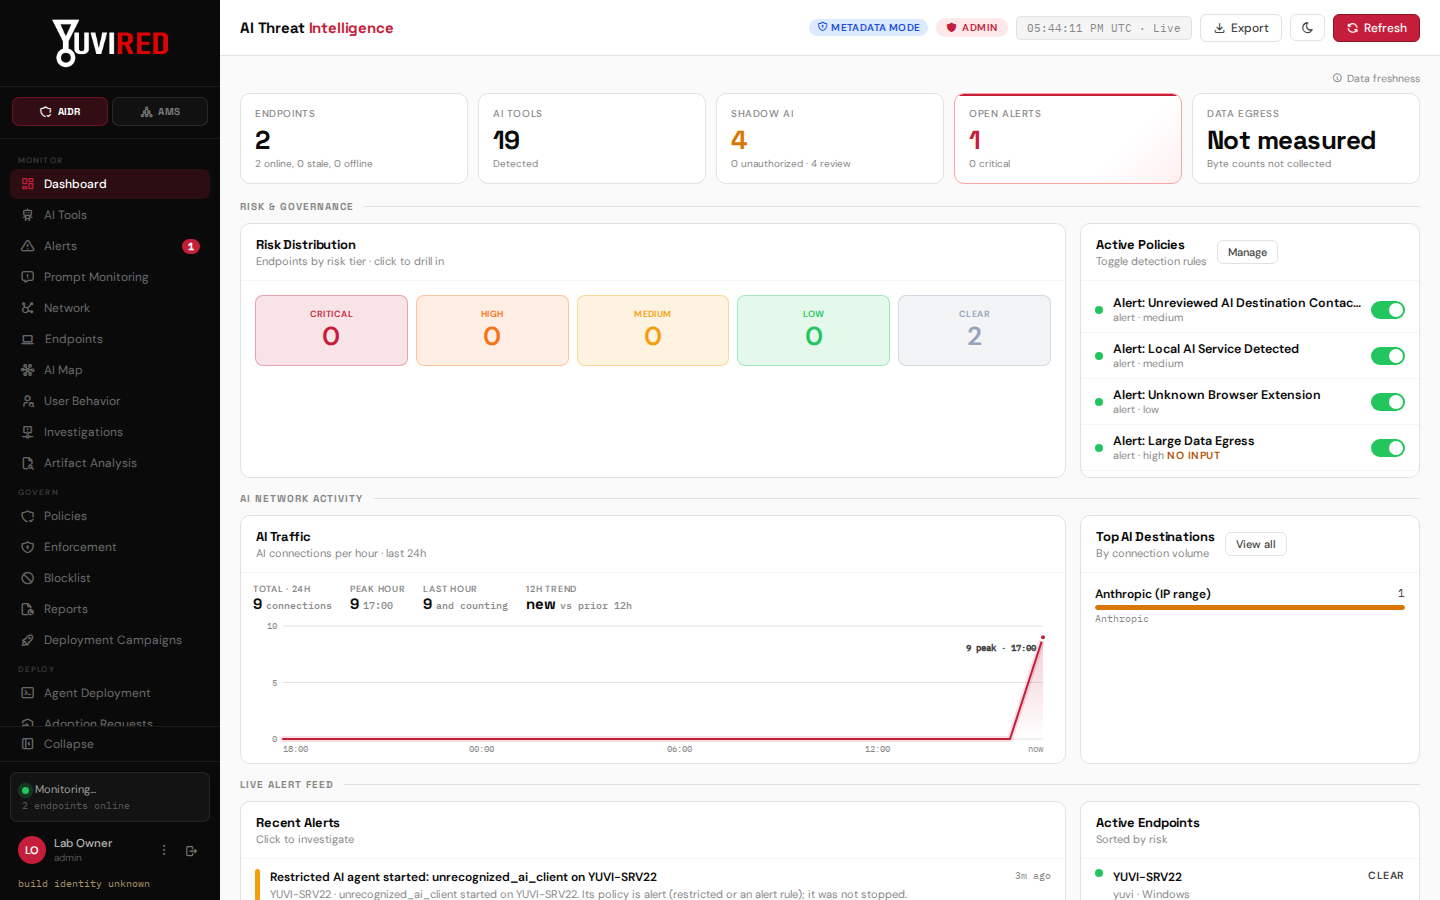
The Dashboard of a lab install with two computers enrolled. The counts come from lab data.
2. The layout of the console
2.1 The sidebar (left, always dark)
At the top is the YuviRed logo and a two-button switch:
- AIDR (AI Detection and Response): the monitoring and governance pages for AI use in browsers, programs, networks and prompts. Everything in this chapter and the AIDR chapter lives here.
- AMS (Agent Monitoring System): the pages for AI agents such as Claude Code. Covered in the AMS chapter.
Click either button to swap the list below it. The sidebar remembers whether you collapsed it (the Collapse control at the bottom turns it into an icon-only rail; hover an icon to see its name).
The AIDR list is grouped into sections:
| Section | Pages | What they are for |
|---|---|---|
| Monitor | Dashboard, AI Tools, Alerts, Prompt Monitoring, Network, Endpoints, AI Map, User Behavior, Investigations, Artifact Analysis | Seeing what AI is in use and what needs attention. Artifact Analysis only appears for accounts with the artifact permission, and the feature is off by default. |
| Govern | Policies, Enforcement, Blocklist, Reports, Deployment Campaigns | Deciding what is allowed, taking response actions, producing reports. Enforcement is hidden from View Only users. Blocklist is Admin only. |
| Deploy (Admin) | Agent Deployment, Adoption Requests | Adding computers. See the deployment guide. |
| Admin (Admin) | Configuration, Legal, Help, Team / Users, Debug / Reset, System Logs | Settings, legal notices, support information, accounts, diagnostics. |
The AMS list holds five areas: Overview, Agents, Governance, Alerts & Actions, Coverage & Connections, plus a Reports shortcut under "Related".
Two small badges draw the eye:
- On Alerts: the number of open alerts. If any open alert is critical, the badge changes to "N crit" (for example "2 crit") in red. When there are no open alerts, the badge is hidden.
- On the AMS list: an amber badge on Agents counts agents that need a decision, and an amber badge on Alerts & Actions counts approvals waiting for a person.
At the bottom of the sidebar:
- A live-updates line ("Connecting live updates..." and then the live state) and a count such as "4 endpoints online · 1 stale".
- Your name and role. Click it for the account menu: My Account, Change Password, Authentication / MFA (multifactor authentication), Recovery Codes, Active Sessions (shown as "soon" and disabled: this build does not track individual sessions) and Sign Out.
- A small build line that tells you which build the console is running. Quote it when you contact support.
2.2 The top bar
From left to right:
- The page title.
- A privacy badge. Metadata mode (blue) means YuviRed keeps activity metadata only for AI prompts and responses. Full inspection (red; with "(raw capture ON)" when original prompt samples are being stored) means content can be kept. Red here is deliberate: content is being stored, and you should be sure that is what you intended. Hover the badge for the full explanation.
- Your role badge and a clock.
- Filter: opens a search bar for the page you are on (search text, status, risk or severity). It filters the table on the current page only.
- Export: downloads the current page as a CSV file.
- The moon icon: switches between the light and dark theme. Light is the default the first time you sign in; your choice is remembered in this browser.
- Refresh: reloads all data now instead of waiting for the next automatic refresh.
2.3 Banners under the top bar
Up to three banners can appear above the page. They are not errors:
- A license banner during the 7-day activation window of a new server, and 30, 14 and 7 days before a paid license ends. The License link next to it opens the license screen.
- An update banner when the daily check-in learns that a newer YuviRed exists. It is a notice only: nothing installs by itself. Dismiss hides it for that version.
- A critical alert banner (red) naming the most recent open critical alert. Investigate opens the Alerts page. The small x dismisses it.
3. The Dashboard, widget by widget
Open Dashboard from the Monitor section. A small "Data freshness" label at the top right of the page explains timing; see section 4.
3.1 The five number cards
Each card is clickable and takes you to the page that explains the number.
| Card | What the number counts | Sub-line under it | Click goes to |
|---|---|---|---|
| Endpoints | Computers enrolled in YuviRed. | "N online, N stale, N offline" | Endpoints |
| AI Tools | Distinct AI tools seen on your computers (programs, browser AI sites, extensions, local services). | "Detected" | AI Tools |
| Shadow AI | Tools classified Unauthorized plus tools still Under Review. | "N unauthorized · N review" | AI Tools, filtered to the shadow list |
| Open Alerts | Alerts that are still open (not resolved, not closed as false positive). | "N critical" | Alerts, filtered to open |
| Data Egress | Bytes sent to AI services. In this release it always reads "Not measured". | "Byte counts not collected" | Network |
How to read them:
- Online, stale, offline. A computer checks in about every 60 seconds. It reads online when its last check-in was within 3 minutes (180 seconds), stale from 3 to 10 minutes, and offline beyond 10 minutes. A stale computer is a soft warning (a sleeping laptop, a network blip). Offline means YuviRed has heard nothing for a while and cannot tell you what is happening on it.
- Shadow AI is "AI use nobody has approved". It is the sum of two different things, which the sub-line separates: tools you have classified Unauthorized (a decision you made) and tools **Under Review** (a backlog nobody has decided on yet).
- Data Egress reads "Not measured" in this release. The endpoint program does not measure how many bytes each connection sends, so YuviRed will not show a zero that could be mistaken for "nothing left the building". Treat the card as a placeholder; use the Network page to see which AI destinations are reached.
Colors on the cards:
- Shadow AI is red when at least one tool is Unauthorized, amber when the count is made only of tools under review, and neutral at zero. A value of "Unknown" is never red.
- Open Alerts is red whenever it is above zero.
3.2 Risk Distribution
A row of five tiles: Critical, High, Medium, Low, Clear. Each shows how many computers sit in that risk tier. A computer's tier is derived from the alerts and classifications that apply to it. Click a tile to open the Endpoints page filtered to that tier ("Clear" opens the whole list). The colors are red, orange, amber, green and grey.
3.3 Active Policies
The first six security policies, each with a switch. The switch turns a detector or rule on or off for everyone; only Admins can change it, and everyone else sees it dimmed. A small amber "no input" tag means the rule has nothing to check in this release (the data egress rule is the example, because byte counts are not measured). Manage opens the Policies page.
3.4 AI Traffic
A chart of AI connections per hour for the last 24 hours. If there was no AI traffic in the last 24 hours, the chart falls back to all time and says so in its sub-heading ("all time (no traffic in last 24h)"). It never claims 24 hours when it is showing something else.
3.5 Top AI Destinations
The six AI services your computers contact most, by number of connections. View all opens the Network page, where you can filter by 24 hours, 7 days or 30 days and download a destination list for your own firewall.
3.6 Recent Alerts
The eight most recently active alerts, newest first, each with a colored bar for severity, the title, the computer, a short detail and the time. An alert that keeps recurring moves to the top because the list sorts by last activity, not by when the alert was first created. Click a row to open the alert. If the alert list cannot be loaded, the panel says "Couldn't load alerts" with a Retry button. It never shows a reassuring "No Alerts" when it simply failed to ask.
3.7 Active Endpoints
The eight computers with the highest risk score, with the signed-in user, the operating system and the risk word. The dot on the left shows liveness: green online, amber stale, grey offline, and an orange warning dot for an online computer at high or critical risk. Click a row to open the computer's detail.
3.8 Detected AI Tools
A table of up to eight tools: Tool, Vendor, Category, Status (the classification), Endpoints (how many computers), Severity and Last Seen. Two chips at the right of the heading summarize: "N total" and, in red when above zero, "N shadow".
4. How fresh is what you see
The Data freshness label at the top of the page has a tooltip with the exact timings. In plain words:
- Each computer checks in every 60 seconds.
- The console re-reads all Dashboard data every 30 seconds. Refresh in the top bar does it now.
- New and repeating alerts are also pushed to the page within about 2 seconds of YuviRed recording them.
- Worst case from an event on a computer to the Dashboard: about 90 seconds for programs, network connections, installed software and local AI services (one 60-second check-in plus one 30-second refresh).
- A new visit to an AI website in a browser takes longer, about 6.5 minutes at the default settings, because the computer scans browser history every 5 minutes. The scan interval can be tuned in Configuration under AI & Agent Monitoring, "Browser AI Scan Frequency" (every 2, 5 or 15 minutes).
The Dashboard has no time filter of its own. Its cards show the current state, and its traffic chart covers the last 24 hours. The pages that have time filters are:
| Page | Time choices |
|---|---|
| Alerts | All Time, Last 24 hours, Last 7 days, Last 30 days (by last activity) |
| AI Map | Last 5 minutes, Last 30 minutes, Last hour, Last 24 hours, Last 7 days (default), Last 30 days, All time, Custom range |
| Network | Last 24h, Last 7 days, Last 30 days |
| Prompt Monitoring | Last 1d, 7d, 30d, 90d |
| Reports | A start and end date in a time zone you choose |
If a page looks out of date, check the sidebar line first. If it says live updates are not connected, use Refresh.
5. Reading the colors
The console uses color to mean one thing everywhere:
| Color | Meaning | Examples |
|---|---|---|
| Red | Danger, a violation, something to act on now. | Critical severity; Unauthorized tools; a non-zero Open Alerts count; a blocked prompt; "Full inspection (raw capture ON)". |
| Orange | High severity, triage today. | High alerts; High risk tier. |
| Amber | Unknown, under review, a warning or a partial risk. | Under Review tools; Medium severity; a stale computer; a pending policy; a warning dialog shown to a person. |
| Blue, cyan, purple | Normal activity and informational states. | Monitored tools; Metadata mode; an observed event with no finding. |
| Green | Healthy or approved. | Online computers; Approved tools; Low severity; Protected browser. |
| Grey | Nothing to report, or not measured. | Clear risk tier; offline computers; "Not measured". |
Two cautions:
- Amber and "Unknown" are not green. A card that says "Unknown" or "Not known" means YuviRed could not read the value. It is never a silent zero.
- A zero is only as good as the reporting behind it. If computers are offline, a zero for alerts says YuviRed has not heard about anything, not that nothing happened. Look at the Endpoints card first.
6. Procedure: a five-minute morning check
Purpose. Know in five minutes whether anything needs your attention.
Prerequisites. A signed-in account. Computers already enrolled.
Steps.
- Open Dashboard. Read the sidebar line and the Endpoints card. You should see most computers online. If many are offline, stop and read the Endpoints page first (section 7 below): an alert count is unreliable when computers are silent.
- Look at Open Alerts. If it is red, click the card. You should land on the Alerts page showing open alerts. Sort with Risk first to see the worst first.
- Look at Shadow AI. If it shows red "N unauthorized", click it to see which tools. If it is amber (review only), decide whether to classify those tools now or later (see the AIDR chapter).
- Scan Recent Alerts for anything marked critical (red bar). Click one to read its Why section.
- Check the top-bar badge. It should say Metadata mode unless you deliberately enabled content capture.
What you should see. A page with no red items, or a short list of alerts you can open directly.
How to confirm. Click Refresh. The numbers should not change much. If they jump, something is active right now: stay on the page and watch Recent Alerts for a minute.
Common problems.
- Cards show "...". The page is still loading. Wait a few seconds, then use Refresh.
- A card shows "Unknown". The server could not answer for that number. Click Refresh. If it persists, open System Logs (Admin) and look for errors from the dashboard.
- "Couldn't load alerts" in Recent Alerts. Click Retry. Nothing is hidden; the panel refuses to show a false all-clear.
- A computer you expect is not in Active Endpoints. That panel shows only the eight highest-risk computers. Open Endpoints for the full list.
7. Where to click next
| You want to | Go to | Then |
|---|---|---|
| See why a number is red | The card's linked page | Read the filtered list |
| Understand one alert | Alerts, click the row | Read Who, What, Where, When, Why, Action |
| Decide whether an AI tool is allowed | AI Tools | Use the Classify drop-down on the row |
| See every computer and when it last checked in | Endpoints | Use the status filter: Online, Stale, Offline |
| See what a person typed that was flagged | Prompt Monitoring | Open an event |
| See which AI services are reached | Network | Pick 24h, 7 days or 30 days |
| See who uses AI and how | AI Map, User Behavior | Use the time range and the Activity or Detections mode |
| Hand leadership a document | Reports | See the Reports chapter |
| Check AI agents | Switch the sidebar to AMS | Start at Overview |
The Endpoints page in brief
Endpoints ("Enrolled Endpoints") lists every enrolled computer. Filters: a search box (host, user or IP), operating system, status (Online, Stale, Offline), risk (Critical to Clear), agent version, and a sort (name, last seen, risk). Click a row to open the computer's detail with its tools, alerts and telemetry. A second panel, Extension Changes, lists installs, removals, enables, disables, version and permission changes of AI browser extensions (metadata only, not what the extension does).
Any signed-in console user can read endpoint identity and raw telemetry, as stated in the YuviRed data notice. Give console accounts only to people who should see that.
The AI Map and User Behavior in brief
- AI Map answers "who is using AI, which apps, and which providers are involved". Two modes: Activity (what is happening) and Detections (what was flagged). The filter bar has a search box, the time range, a grouping (none, risk, operating system, status) and a status filter (All, Approved, Monitored, Under review, Flagged / Alert). The bookmark button says "Saved views are not implemented yet"; that is accurate.
- User Behavior shows Highest-Risk Users, Behavior Patterns and **Top AI Users by Activity** (User, Hosts, AI Tools, AI Events, Dependency, Risk, Flag). Users are attributed from the account that owned the process plus network correlation. There is no directory lookup, so a shared or service account appears as reported (for example SYSTEM).
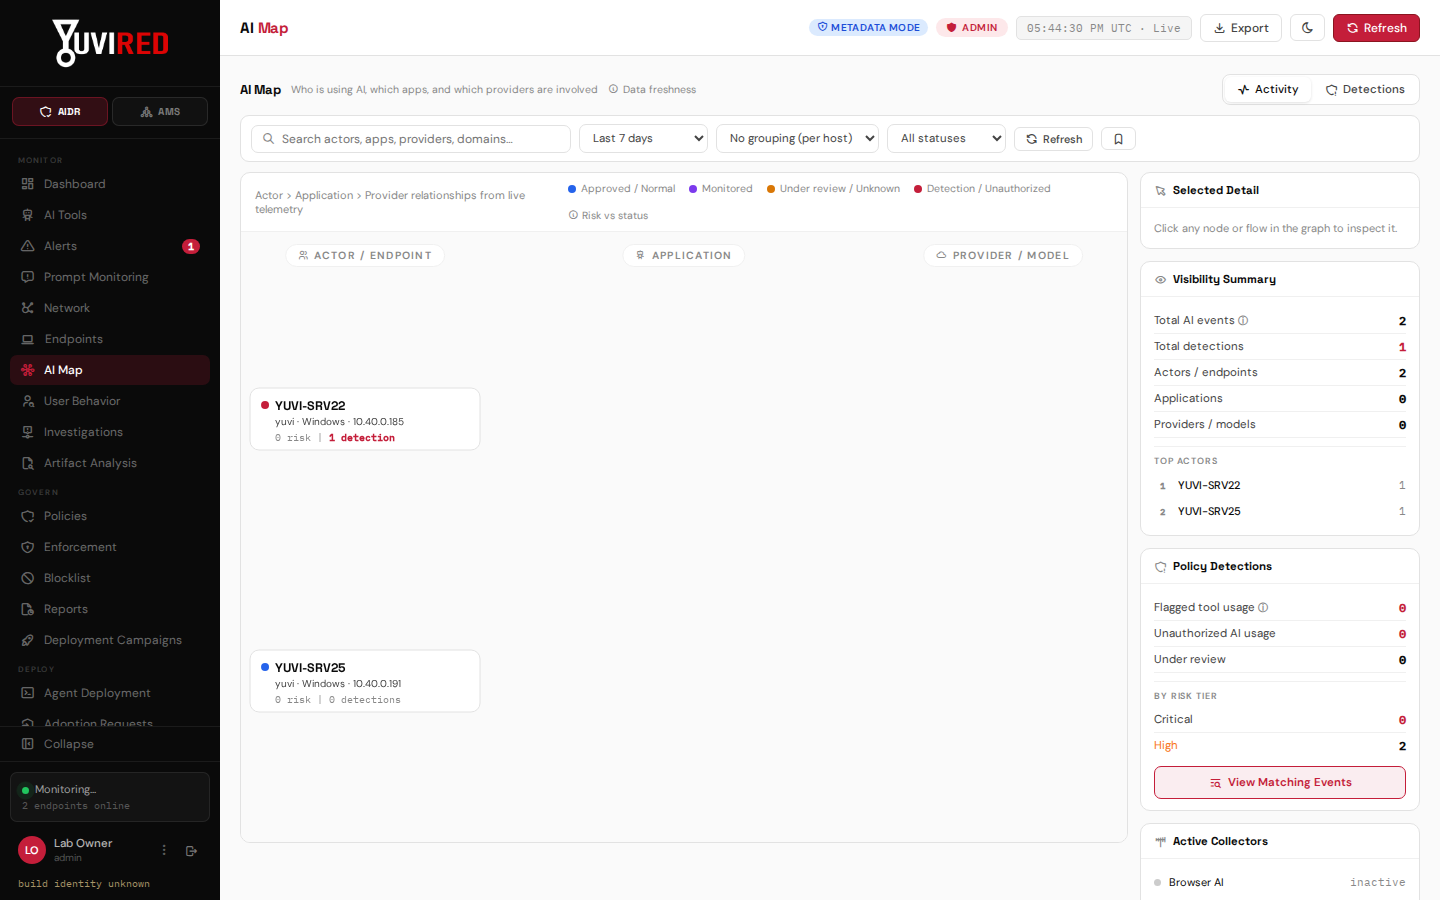
The AI Map. Computers appear as actors on the left, AI applications in the middle and providers on the right.
8. Limits to keep in mind
- The Dashboard shows what YuviRed's endpoint program reported. Computers without the program, and AI use on unmanaged devices, are invisible.
- Byte counts are not collected, so Data Egress reads "Not measured".
- The Active Endpoints, Recent Alerts and Detected AI Tools panels each show at most eight rows.
- Red does not mean something was blocked. YuviRed's AIDR side watches and alerts; it changes anything only in the narrow cases described in the AIDR chapter (Enforcement: a managed-browser policy on named Windows computers), the Sensitive Data chapter (a warning or block in the browser before a prompt is sent) and the AMS chapter (Enforce mode ending an AI agent program). It never blocks network traffic.
- Times in the console follow your computer's clock and time zone; the clock in the top bar shows your local time.